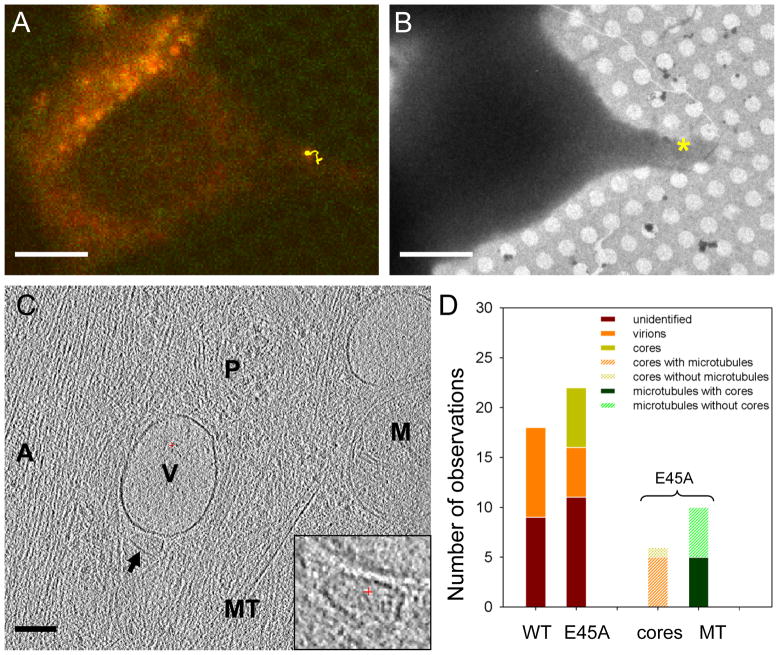
Figure 4.
Direct visualization of HIV-1 E45A cores in HeLa cells. (A) 3D tracking (yellow trace) of an HIV-1 E45A particle, overlaid on the last fluorescence image of HeLa cells in the time-lapse confocal series. (B) A low dose cryoEM image of the correlated region taken at low magnification (3,500 ×). The * indicates the location of the fluorescent particle. (C) A 4 nm thick tomographic slice from the 3D tomogram of the correlated region of the HeLa cell. The arrow points to an HIV viral core. Other cellular structures are labeled as “A”, actin filaments; “MT”, microtubule; “V”, vesicle; “M”, mitochondria; “P”, protein complexes. Inset, an enlarged view of the HIV core structure. (D) Quantitative analysis of the occurrence of HIV-1 virions and cores in cellular tomograms of infected HeLa cells. Scale bars, 10 μm in A & B, 0.1 μm in C. See also Figure S4.

