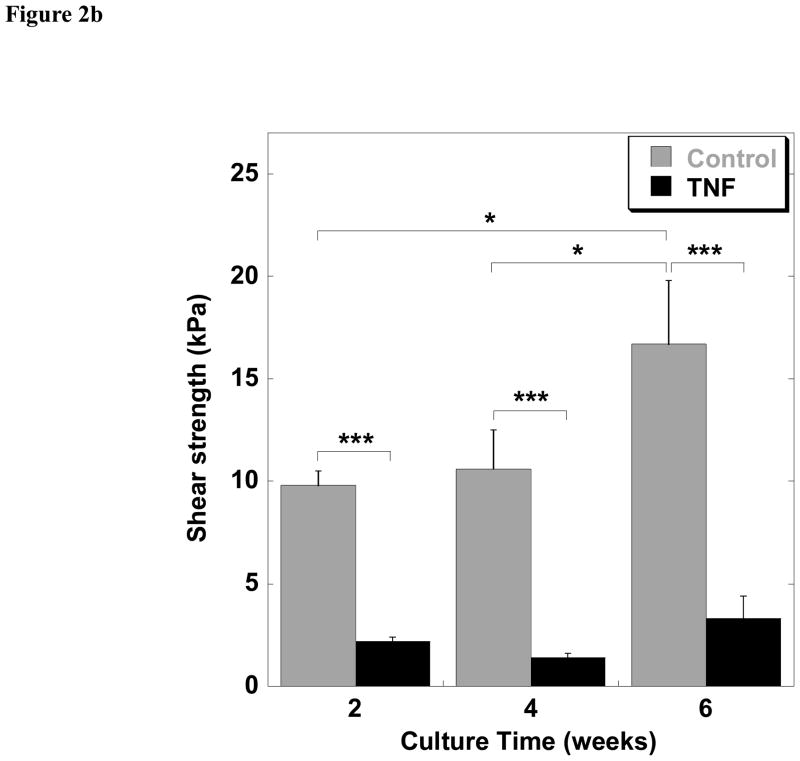
Figure 2.
Interfacial shear strength of repair over time in culture. (a) Interfacial shear strength of control (untreated) explants and explants treated with 10 ng/ml IL-1 at 2, 4, and 6 weeks of culture. (b) Interfacial shear strength of control (untreated) explants and explants treated with 10 ng/ml TNF-α at 2, 4, and 6 weeks of culture. Data are presented as mean ± SEM (n = 9 per treatment and time point, *p<0.05, ***p<0.001).


