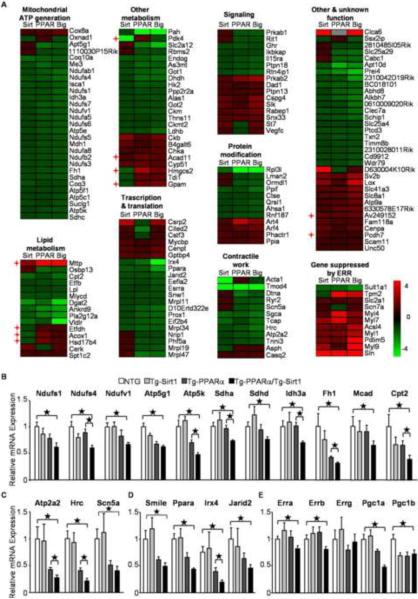
Figure 3.
Gene expression profiles of ERR target genes in transgenic mice. (A) A heat map representing the expression profile of ERR target genes in transgenic mice. Known PPAR target genes are indicated by cross mark. Relative gene expression levels of ERR target genes regulating (B) mitochondrial metabolism, (C) contractile work, (D) transcription factors and (E) PGC-1 and ERR isoforms in the indicated transgenic animals are shown (N=8–16). Error bars represent S. E. M.

