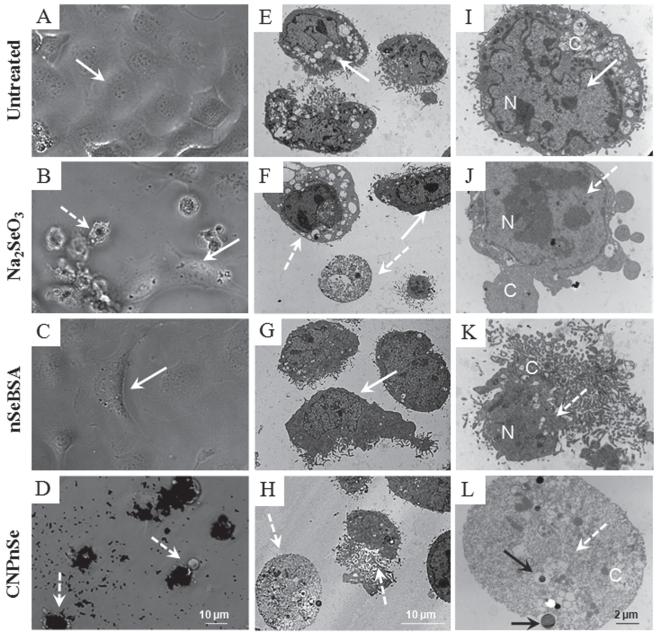
Figure 3.
Morphology of malignant mesothelial cells treated with competing formulations of selenium as a chemotherapeutic agent. Cells were exposed to Na2SeO3, nSeBSA or CNPnSe at the equimolar dose of 25 μM of selenium for 72 hours. (A–D): Phase-contrast optical micro-graphs. In contrast to nSeBSA, where the decrease in cell density may be due to the induction of cell growth arrest together with apoptotic cell death, CNPnSe, at the same dose, decreases cell density by induction of cell death by necrosis, and this effect is stronger than the effect of Na2SeO3 where cell death is induced by both apoptosis and necrosis. (E–L): Thin-section TEM images. Cell death and internalization of CNPnSe. Solid arrows: live cell with intact nucleus (N) and cytoplasm (C). Dashed arrows: dead cell with degraded nucleus and/or cytoplasm. Black arrows: internalized CNPnSe.

