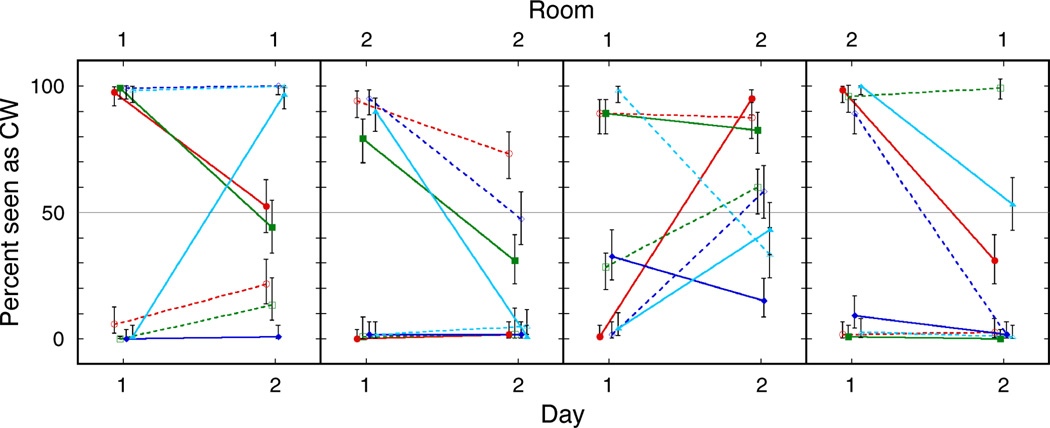
Figure 3.
Percent of test trials seen as clockwise, for four groups of subjects, tested in different combinations of Room 1 and Room 2 on Days 1 and 2. Perceptual outcome at the top stimulus location is denoted with filled symbols, perceptual outcome at the bottom location with outline symbols. Colors represent subjects, with four subjects in each group.

