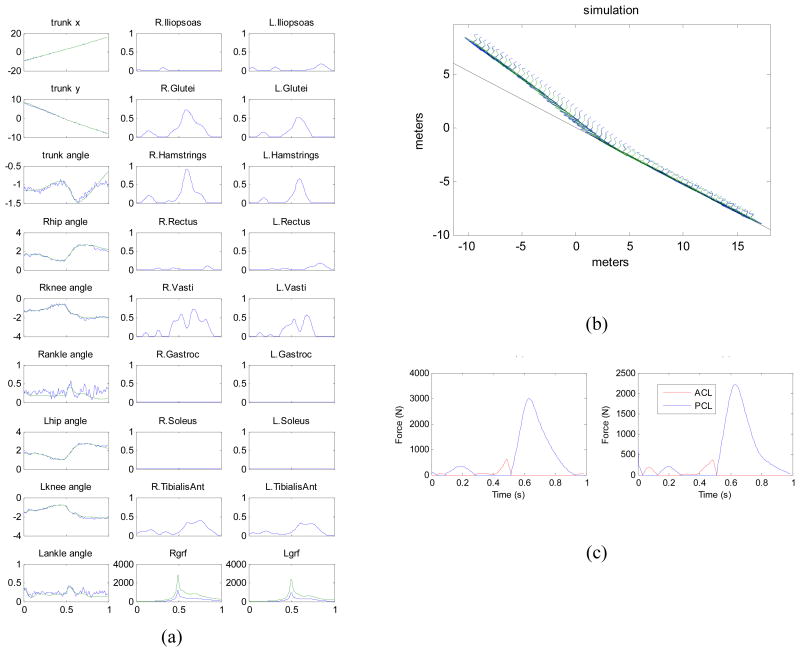
Fig. 7.
(a) Optimal control solution for the skiing model. Left column shows simulated kinematic variables in meters and radians (solid lines) compared to data collected during the 1994 Olympic downhill race (noisy thin lines). The other columns show neural excitations for the 16 muscles, and the horizontal and vertical ground reaction forces. (b) Stick figure rendering of the same movement, beginning in the aerial phase. Black line is the snow surface. (c) Forces in the anterior cruciate ligament (ACL) and posterior cruciate ligament (PCL) in the left and right knee.

