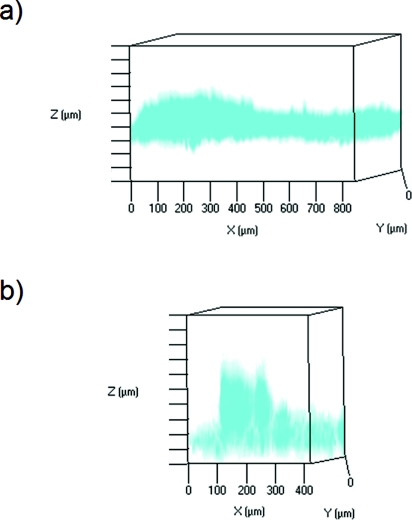
Figure 5.
Maximum projections (in red) rendered from acquired z-stack multiphoton images of quantum dot delivery into porcine skin. (a) Topically applied quantum dots one hour after application. The skin was oriented with the stratum corneum at the top of the imaging window. (b) A single microneedle one hour after application. The image was oriented with the microneedle and the stratum corneum at the bottom of the imaging window. In these figures, the spacing between the bars on the Z-axis is 50 μm. Inversion of the colors was performed to facilitate viewing.

