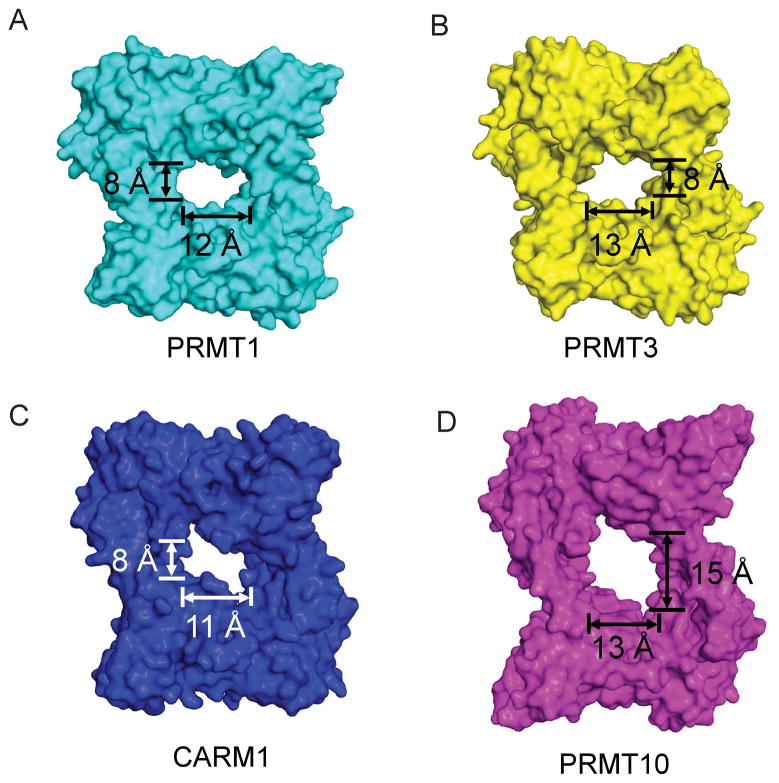
Figure 4. Surface representation of various PRMT paralogs, including rat PRMT1 (PDB: 1ORI) (A), rat PRMT3 (PDB: 1F3L) (B), mouse CARM1 (PDB: 3B3F) (C) and AtPRMT10 (D).
For consistency, the sequences N-terminal to helix X (including helix X) are deleted from the structure. The dimensions of the central cavities are indicated.

