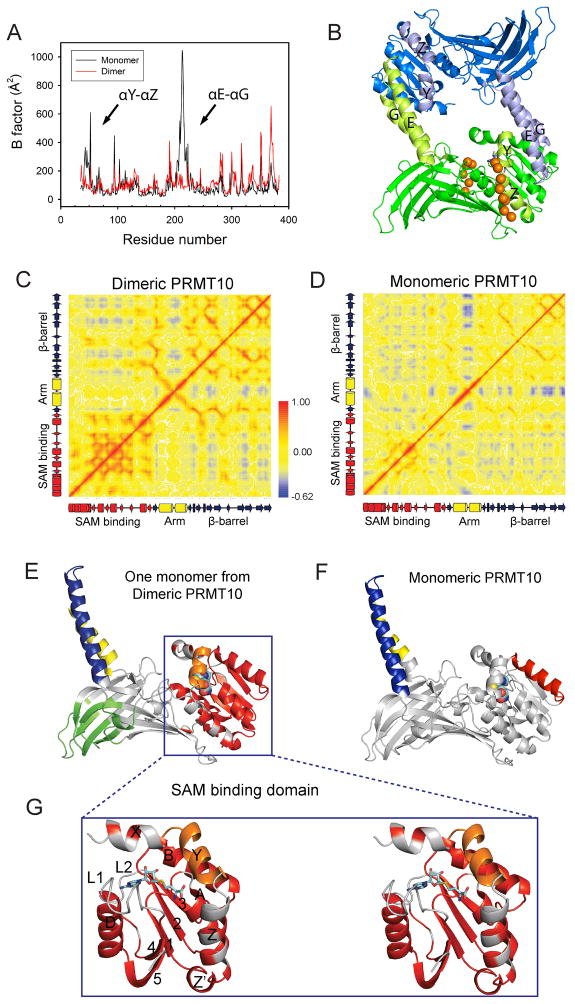
Figure 8. Effects of dimerization on the motion of AtPRMT10.
(A) Local fluctuation of residues in dimeric and monomeric AtPRMT10. Major differences between monomeric and dimeric AtPRMT10, including the two N-terminal helices αY-αZ and the dimerization arm (αE-αG), are highlighted by arrows and labeled. (B) The structure of a dimeric AtPRMT10. The two monomers are colored in blue and green respectively. The regions that displayed dramatically reduced local fluctuations in dimeric PMT10 are colored in light green in one monomer and in light blue in the other monomer. The putative substrate sites are represented in orange balls. Covariance analysis of dimeric AtPRMT10 (C) and monomeric AtPRMT10 (D). The values of residue-residue correlation coefficients range from blue (anticorrelated, −0.62) to red (correlated, +1.0), with non-correlated residue pairs colored in yellow. Schematic representations of the secondary structure corresponding to the residues on x-axis and y-axis are presented from left to right and bottom to top. (E), (F) Clustering of correlated residues in dimeric AtPRMT10 (E) and monomeric AtPRMT10 (F). Clusters with correlation coefficients higher than 0.7 are shown in different colors (other than gray) and all other regions are colored in gray. SAH is shown as sticks and spheres to highlight the location of the SAM binding pocket, although it is removed from the crystal structures before MD simulations. (G) An expanded stereo-view of the SAM binding domain of Figure 8E, with the secondary structures labeled.

