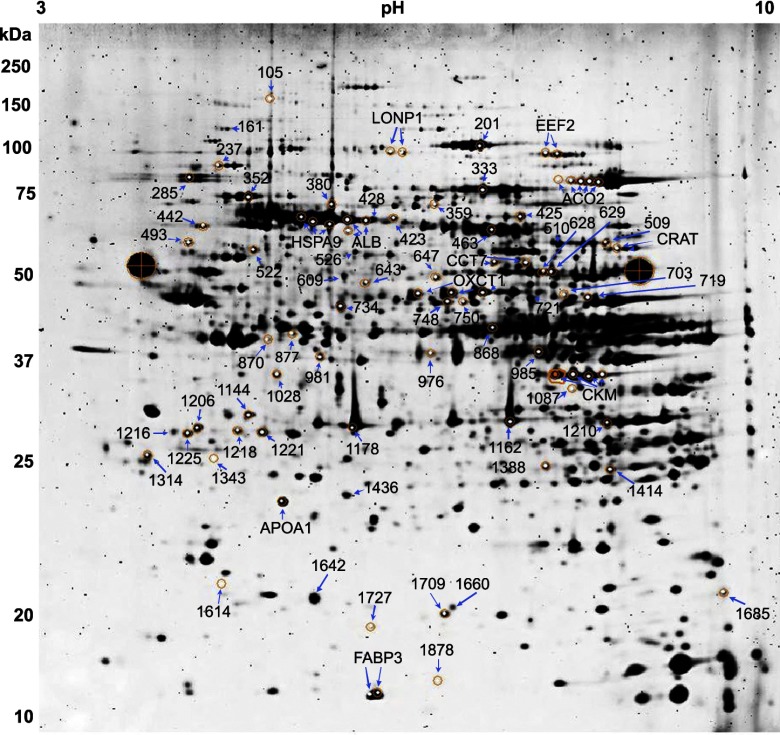
Fig. 2.
Representative 2-dimensional gel showing the separation and location of picked heart proteins. Numbers to the left of the gel denote the approximate molecular weight (kDa) of the proteins, while the numbers at top represent the pH gradient of the 1st dimension. Orange circles represent the area targeted by the robotic spot picker. The 2 large black circles with cross-hairs are reference markers for the robotic spot picker. Protein spots are labeled by either their DeCyder assigned spot number or gene symbol in cases where multiple isoforms were identified.

