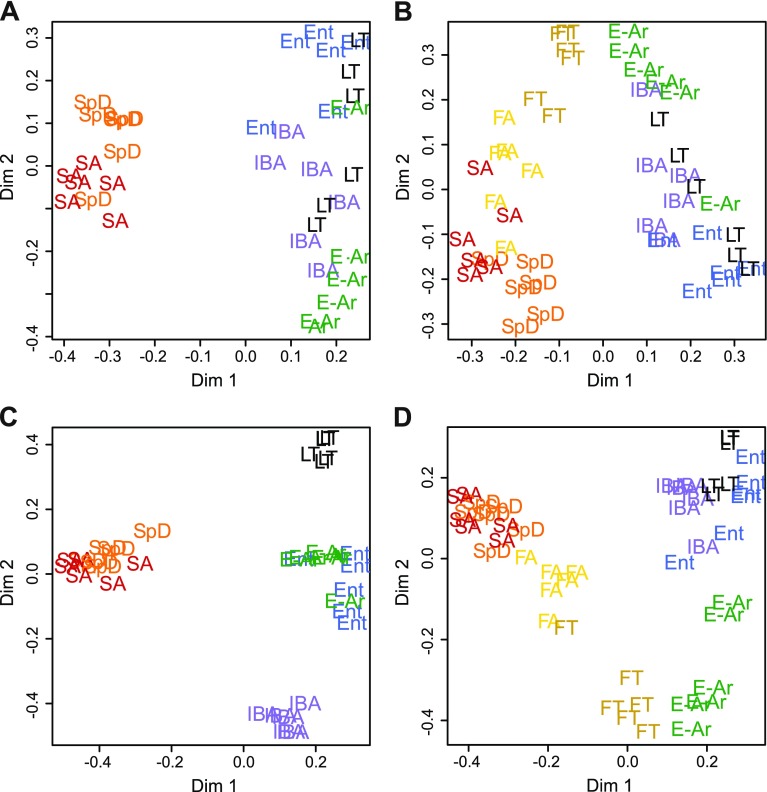
Fig. 3.
Unsupervised clustering of individual ground squirrels using heart proteins separates summer homeotherms from winter heterotherms and highlights the fall transition. 2-dimensional scaling plots from Random Forests (RF) analyses. Individual samples are plotted and labeled by group symbol. Results of analysis using animals from: A: SpD, SA, IBA, Ent, LT, and E-Ar; B: same as in A, except that FA and FT were included. The top discriminators from these analyses were reanalyzed by RF using: C: top 6 explanatory spots from RF in A; D: top 8 explanatory spots from RF in B. See text and Fig. 4 for protein spot identifications.

