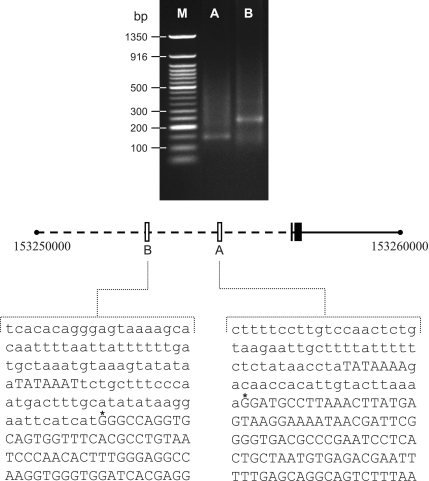
Fig. 1.
Sequence of each promoter region as determined by 5′-rapid amplification of cDNA ends (RACE) analysis. Top: agarose gel (1.5%) analysis of 5′-RACE primer-specific nested PCR products. Lanes A and B represent amplifications with primer pairs AUAP/GSP2 (promoter A) and AUAP/GSP3 (promoter B), respectively. M, size markers (Invitrogen 1 Kb ladder). Bottom: the center line is the chromosome 4 map, with the open boxes representing the 2 promoters relative to DEspR coding exons (black boxes). Nucleotide sequence of promoters A and B are shown. *The 2 transcription start sites identified by 5′-RACE.

