Fig. 4.
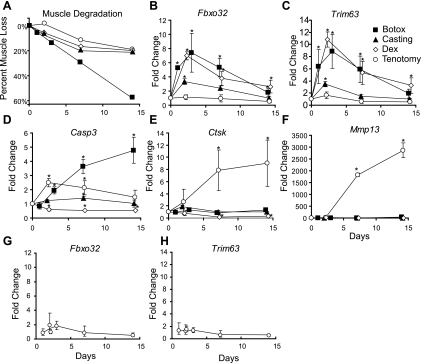
Differential regulation of protein degradation genes between 4 models of skeletal muscle atrophy. A: percent muscle loss in 4 models of skeletal muscle atrophy. Losses were calculated by comparison to the respective contralateral control and were expressed as average losses. Fold changes in mRNA expression levels for Fbxo32 (B), Trim63 (C), Casp3 (D), cathepsin K (Ctsk, E), and Mmp13 (F) in gastrocnemius muscles during muscle atrophy induced by 4 different atrophy models as measured by qRT-PCR. Fold changes in messenger RNA expression levels of Fbxo32 (G) and Trimb3 (H) in the gastrocnemius muscle during tenotomy induced muscle atrophy as measured by qRT-PCR. Each point represents average fold changes compared with the respective contralateral control. Error bars represent SD; n = 3. *P < 0.05.

