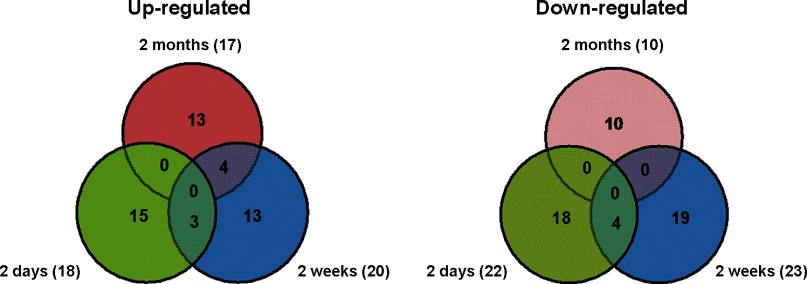
Fig. 2.
Distribution of microRNAs (miRNAs) differentially regulated in 2 days, 2 wk, and 2 mo post-MI. Numbers in each partition represent the number of commonly or uniquely regulated genes in each animal model. The size of each partition is not to scale. The total number of regulated genes is defined on the left and right side of the diagrams.

