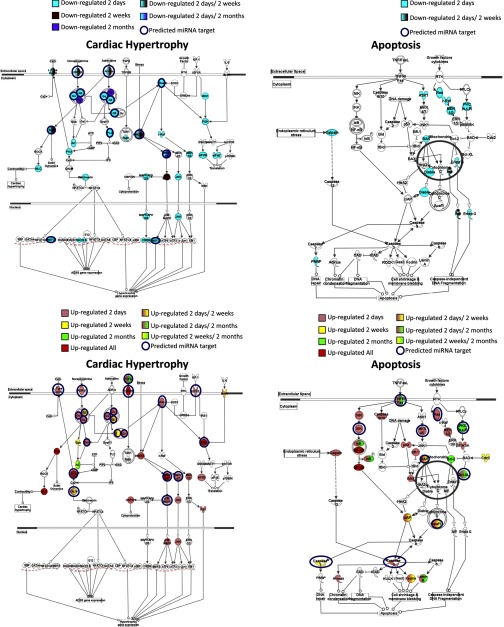
Fig. 5.
Canonical pathway analysis of differentially regulated genes. Genes up- or downregulated post-MI were subjected to Ingenuity Pathway Analysis. Cardiac hypertrophy and apoptosis pathways are shown. Genes are color coded according to regulation at different time points post-MI. miRNAs that can potentially regulate specific genes are annotated in the figure. A list of all mRNAs that are targets for the deregulated miRNAs can be found in Supplemental Table S5.

