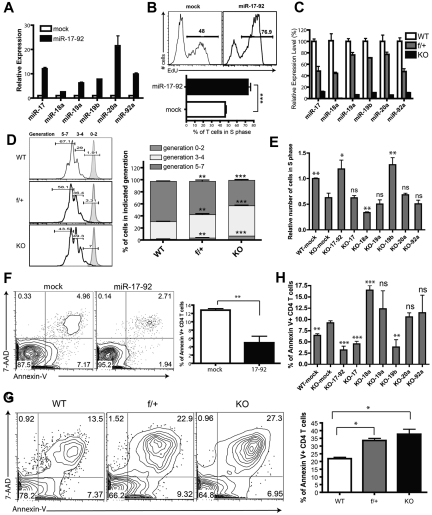
Figure 1.
The functionality of miR-19b and miR-17 in antigen-stimulated CD4+ T-cell proliferation and activation-induced cell death. (A,C) Assessment of miR-17-92 relative expression in CD4+ T cells by qPCR. Data were normalized to a reference small RNA U6. Bar graph shows means ± SEM from 3 independent experiments. (A) LN T cells from 5C.C7 TCR-transgenic mice were primed by syngeneic APCs loaded with agonist peptide MCC (10μM) and transduced with retrovirus encoding GFP alone (mock) or the mir-17-92 gene with GFP. Three days later, CD4+GFP+ T cells were FACS sorted, and the expression of miRNA was analyzed by qPCR. Data were normalized to the mock group. (B) mir-17-92 genes were introduced into 5C.C7 T cells as described in panel A. Cells were selected by puromycin for 48 hours, and restimulated with MCC-loaded CH27 APCs (10μM) for 24 hours. 5-ethynyl-2′-deoxyuridine (EdU) was supplied into the culture medium 3 hours before cell fixation. The percentage of CD4+GFP+ T cells in the S phase was measured with the Click-iT EdU flow cytometry assay (Invitrogen). Top: representative FACS plot; bottom: statistical analysis of 5 independent experiments. (C) Expression of miRNAs in CD4+ T cells from LNs and spleens of miR-17-92f/fCD4-Cre− (WT), miR-17-92f/+CD4-Cre+ (f/+), and miR-17-92f/fCD4-Cre+ (KO) littermates. Data were normalized to WT. (D) CD4+CD25− T cells from LNs and spleens of WT, f/+, and KO littermates were labeled for 10 minutes at 37°C with CFSE at a ratio of 3 × 10⁶ cells/4μM chemical, followed by washes with complete culture medium, and were then activated by 1 μg/mL of plate-bound anti-CD3 and anti-D28 Abs (eBioscience) for 72 hours. Left: representative FACS plot showing CFSE dilution. Tinted peaks represent CFSE-stained T cells without stimulation; right: statistical analysis of 3 independent experiments. (E) CD4+CD25− T cells from WT or KO mice were primed and transduced with indicated retroviruses. After 2 days of puromycin selection, cells were restimulated with anti–CD3/CD28 for 24 hours, and the number of T cells in the S phase was determined by staining of pulsed EdU. Bar graphs summarize means ± SEM from 4 independent experiments and data were normalized to WT-mock. The statistical significance was assessed in comparison with the KO-mock group. (F) LN T cells from 5C.C7 TCR-transgenic mice were primed and transduced with retrovirus encoding GFP or miR-17-92 as described in panel A. Three days later, viable cells were enriched by density gradient centrifugation and then restimulated with CH27 loaded with MCC (10μM) for 24 hours, and the status of AICD was assessed by annexin V and 7AAD staining (BioLegend). The bar graph summarizes the means ± SEM from 4 independent experiments. (G) CD4+CD25− T cells from LNs and spleens of WT, f/+, and KO littermates were stimulated with anti–CD3/CD28 Abs for 72 hours, and the percentages of CD4+ T cells undergoing apoptosis were assessed by annexin V and 7AAD staining. The bar graph summarizes means ± SEM from 3 independent experiments. (H) CD4+CD25− T cells from LNs and spleens of KO mice were primed and transduced with retrovirus encoding individual miRNAs of miR-17-92 as described in panel E. Three days after transduction, viable CD4+ T cells were enriched and restimulated with anti-CD3/CD28 for 24 hours. The profiles of restimulation-induced apoptosis were measured by annexin V staining. Bar graphs summarize the means ± SEM from 3-5 independent experiments. The statistical significance was assessed in comparison with the KO-mock group. *P < .05; **P < .01; ***P < .001; and ns, no significance.

