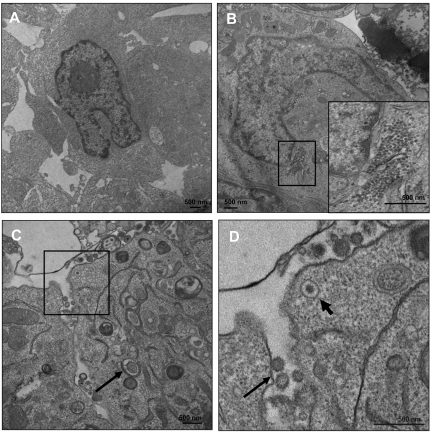
Figure 6.
ER stress induces virus production. LCLs were treated with DMSO (A) or TG (B-D) and at 5 days after treatment the cells were processed for EM. (B) Accumulation of nucleocapsid cores near the nuclear membrane with an inset of a higher magnification of the nucleocapsid cores. (C) EBV-enveloped virus transport and budding at the plasma membrane. Arrow indicates the occurrence of a double-membrane vesicle, a hallmark of autophagy. (D) Higher magnification of the boxed area in panel C. Thick arrow shows an enveloped virion being transported to the plasma membrane and the thin arrow shows a budding virus.

