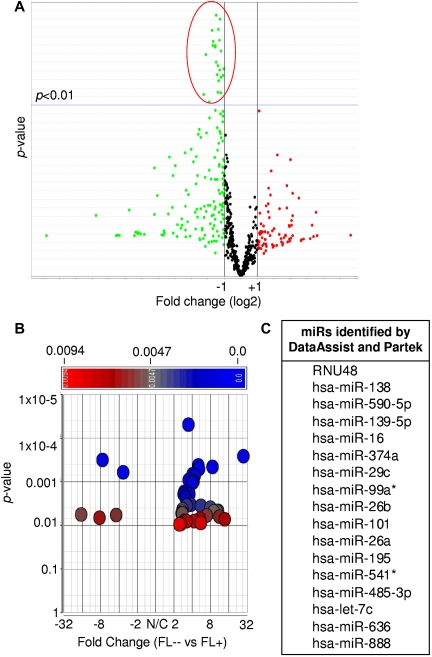
Figure 1.
Differentially expressed miRs between t(14;18)–positive (FL+) and t(14;18)–negative FLs without BCL2 expression (FL--). (A) DataAssist analysis using the geometric mean algorithm. FL+ was used as a calibrator. (B) Partek analysis using ANOVA. FL+ was used as a calibrator. (C) Differentially expressed miRs identified by both DataAssist and Partek.

