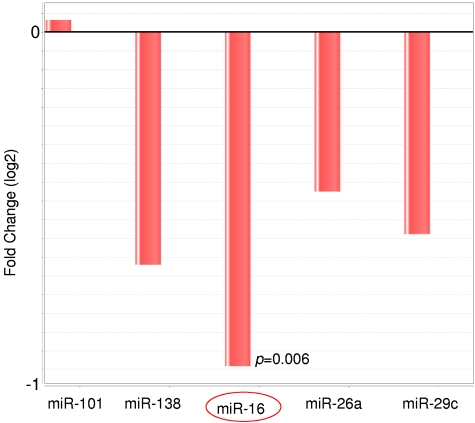
Figure 3.
Relative expression level of the miRs miR-101, miR-138, miR-16, miR-26a, and miR-29c in t(14;18)–negative FLs compared with t(14;18)–positive FLs as detected by quantitative RT-PCR. The expression level was determined in an independent FFPE validation set of 26 FLs without t(14;18) and 23 FLs with t(14;18). Four of the 5 miRs showed decreased expression in t(14;18)–negative FLs, and the difference was statistically significant for miR-16.

