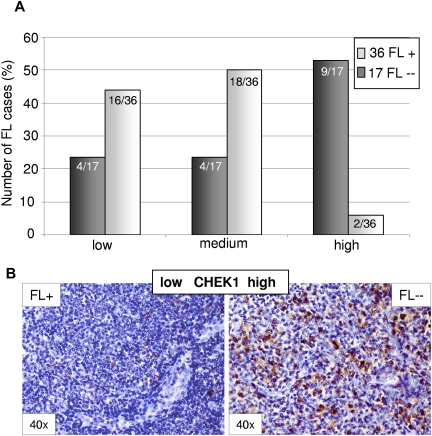
Figure 4.
Differential expression of the miR-16 target CHEK1 between t(14;18)–positive (FL+) and t(14;18)–negative FL (FL--) without BCL2 expression as detected by immunohistochemistry. (A) CHEK1 expression was increased in t(14;18)–negative FLs (P < .001, likelihood ratio). (B) Representative stainings for CHEK1 in FL+ and FL--. Images were captured using a Olympus, Color View, BX50 microscope, the Color View digital camera, and the analysis work soft imaging system (all Olympus).

