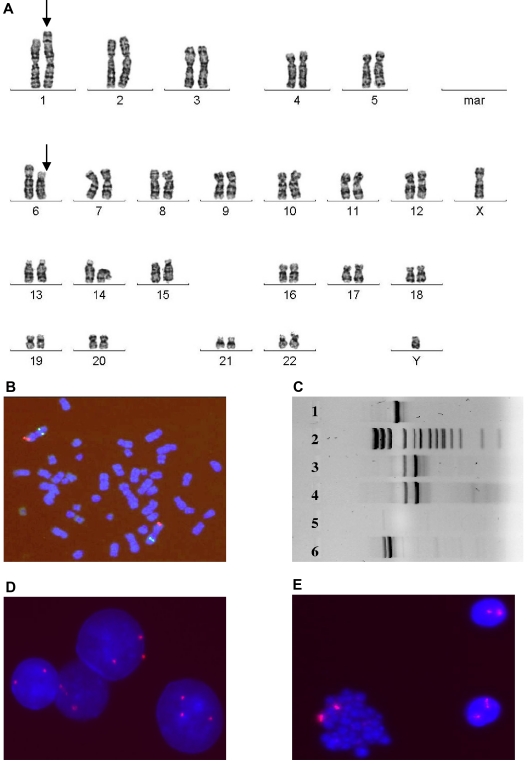
Figure 2.
MSC (1282) demonstrates distinct aberrations compared with markers detected in HCs. (A) G-banding image shows translocation t(1;6)(p32;p12) (arrows) in MSCs. (B) FISH image with probes 1p36(red)/1q25(green) demonstrates the absence of this aberration in HCs. (C) RT-PCR for t(11;19)(q23;p13.3) demonstrates the aberration in HCs (lane 4), but not in MSCs (lane 5). Lane 3 is a positive control for the MLL-ENL fusion gene. Lanes 1 and 6 illustrate 2 alternative MLL-ENL fusion genes, and lane 2 displays the size standard. FISH image with CEP probes for chromosome 8 confirms trisomy 8 in HCs (D) and the absence of aberrations in MSCs (E).

