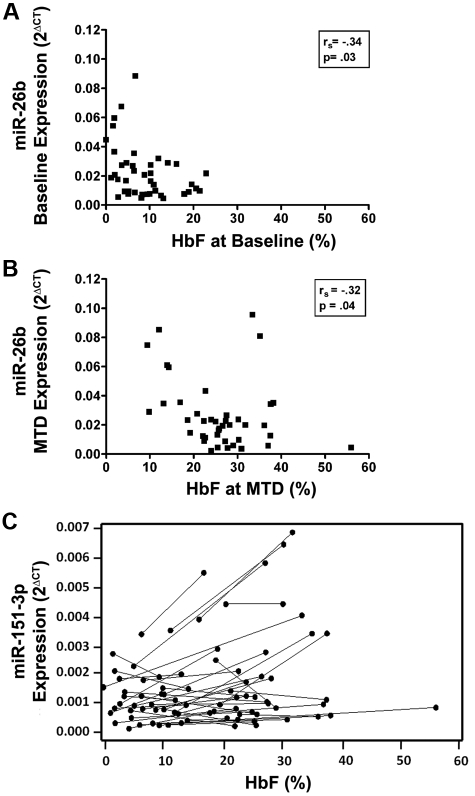
Figure 4.
MiRNAs 26b and 151-3p are associated with HbF. (A) Expression of miRNA 26b at baseline and at MTD was inversely associated with HbF levels at baseline and MTD. (B) respectively as identified by the Spearman correlation coefficient. (C) HbF levels and miRNA 151-3p expression in paired samples from baseline to MTD for each patient (represented by individual lines), and analysis of this data with a mixed model indicated a significant association between change in HbF and a change in miRNA 151-3p in response to hydroxyurea treatment (P < .05).

