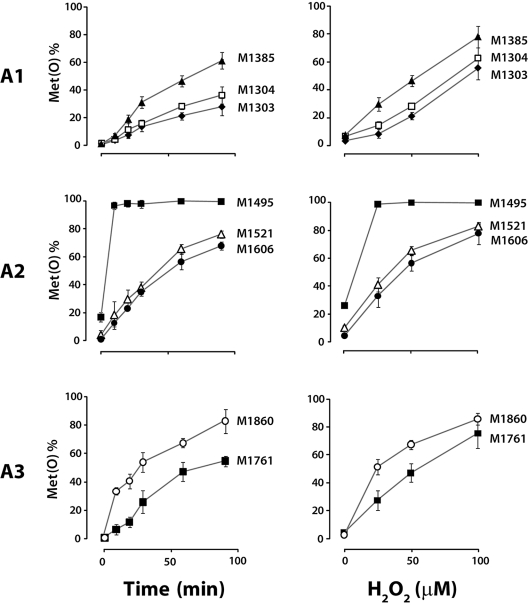
Figure 5.
Time course and H2O2 concentration dependence of methionine oxidation under shear stress. Left panel: Time course of methionine oxidation in the A1, A2, and A3 domains. Plasma VWF was incubated with 50μM H2O2 and 25nM MPO under shear for the indicated times. Right panel: H2O2 concentration dependence of methionine oxidation in the A1, A2, and A3 domains. Plasma VWF was incubated with the indicated H2O2 concentration and 25nM MPO under shear conditions for 1 hour. Methionine oxidation was analyzed as in Figure 2. The results represent the means ± SD from 2 experiments, with duplicate LC–MS/MS analyses.

