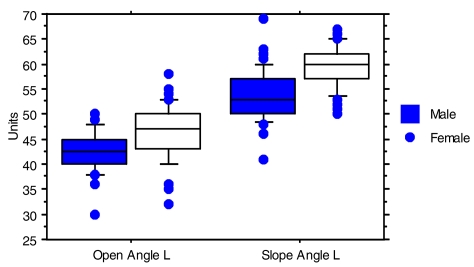
FIGURE 5.
Distribution of Open Angles and Slope Angles measured in the left acetabulum of male and female crash subjects. The box encompasses the 25th to 75th percentiles and is bisected by the median value. Observed values less than 10th percentile and greater than 90th percentile are shown as individual points.

