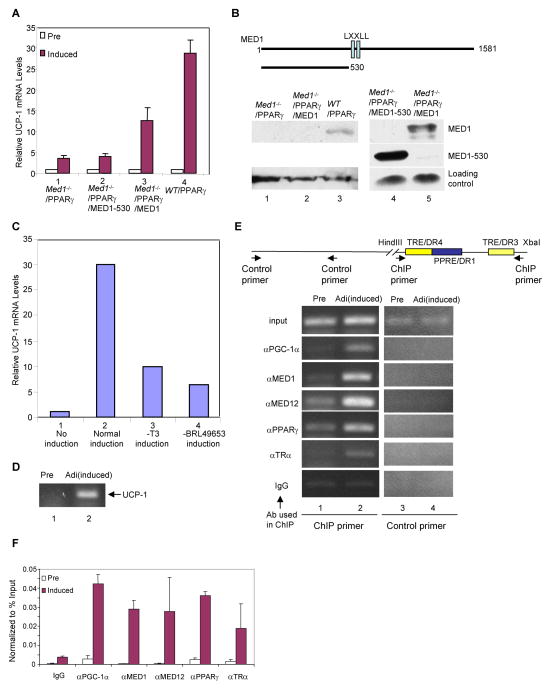
Figure 1. Role of MED1 in UCP-1 induction.
(A). Requirement of the MED1 C-Terminus for UCP-1 induction in differentiated MEFs. WT/PPARγ MEFs, Med1−/−/PPARγ MEFs and Med1−/−/PPARγ MEFs that stably express MED1(1–530) (Med1−/−/PPARγ/MED1–530 MEFs) or full length MED1(Med1−/−/PPARγ/MED1 MEFs) were differentiated to adipocytes, treated to induce UCP-1 gene expression and analyzed for UCP-1 RNA levels by real time RT-PCR as described in Experimental Procedures. Open bars show control non-treated preadipocytes (Pre) and solid bars show UCP-1 induced adipocytes (Induced). Error bars indicate standard deviation of three independent experiments.
(B). Structure and expression levels of MED1 proteins in differentiated MEFs. Top: Schematic representation of Flag-tagged MED1 proteins that were stably expressed in Med1−/−/PPARγ MEFs. Bottom: Analysis of ectopic and endogenous MED1 expression levels by immunoblot with anti-MED1 (lanes 1–3) and anti-Flag (lanes 4 and 5) antibodies.
(C). UCP-1 induction by PPARγ and TR ligands in differentiated MEFs. WT/PPARγ MEFs were first cultured under conditions leading to differentiation to adipocytes and then in complete UCP-1 induction medium (Normal induction, lane 2), induction medium minus T3 (−T3 induction, lane 3) or induction medium minus BRL49653 (−BRL49653 induction, lane 4). UCP-1 expression was monitored by real-time RT-PCR. Non-treated preadipocytes (No induction) are shown in lane 1.
(D) Induction of UCP-1 in brown HIB1B cells detected by RT-PCR.
(E). Induced binding of factors to the UCP-1 enhancer in HIB1B cells. Top: Schematic representation of the UCP-1 enhancer and primers used for ChIP assays. Bottom: ChIP analysis of HIB1B preadipocytes and UCP-1-induced adipocytes with the indicated antibodies.
(F). Induced binding of factors to the UCP-1 enhancer in HIB1B cells. Real time PCR ChIP analyses of preadipocytes and UCP-1 induced adipocytes with the indicated antibodies. Error bars indicate standard deviation of two independent experiments.

