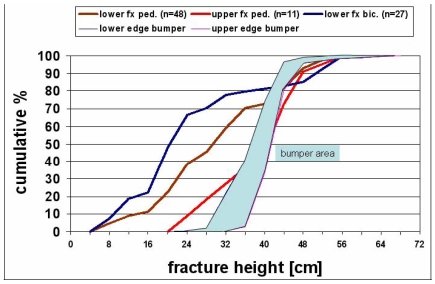
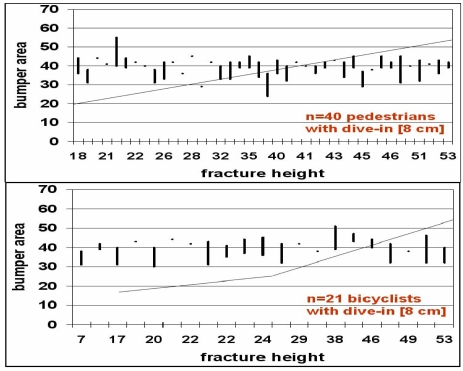
Figure 4.
Figure 4a: Measured fracture heights and effective dynamic bumper heights in cm (the line indicates identical heights). The x-axis is nonlinear; representation of individual data only Figure 4b: Measured fracture heights and effective dynamic bumper heights in cm (the line indicates identical heights). The x-axis is non-linear; representation of individual data only


