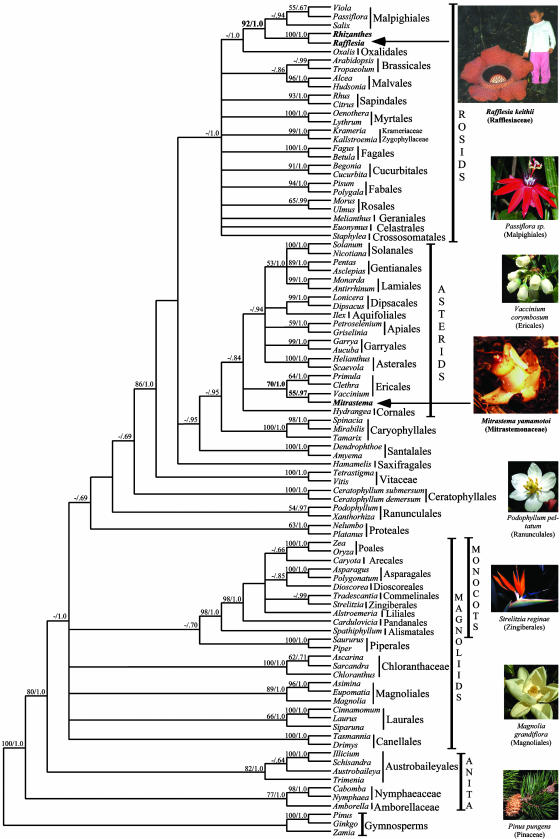
Fig. 1.
Strict consensus tree from an unweighted parsimony analysis of matR mtDNA sequences (number of trees = 61,911, tree length = 2,464, consistency index = 0.5657). BS from the parsimony analysis is listed before the slash, and PP from the Bayesian analysis are listed after the slash for all nodes receiving support of ≥50 (0.5). When present, a dash represents BS < 50. Images of representative species are shown for heuristic purposes.

