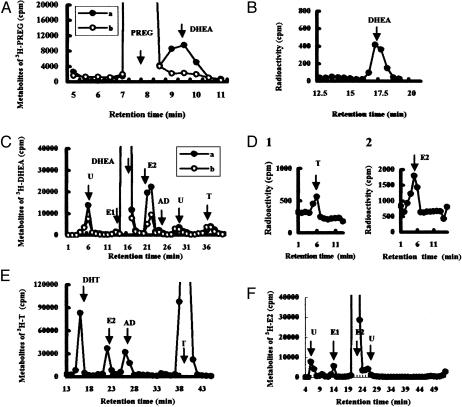
Fig. 7.
HPLC analysis of steroid metabolism in adult rat hippocampal slices. A total of 106 cpm purified metabolites were applied to HPLC. (A) HPLC profiles of [3H]PREG metabolites using elution solvent A. Slices were incubated for 5 h in the absence (line a) or in the presence (line b) of SU-10603. (B) Reverse-phase HPLC (solvent C) of [3H]DHEA fractions from line a in A. (C) Profiles of [3H]DHEA metabolites (solvent B) in the absence (line a) or in the presence (line b) of fadrozole, after incubation of slices for 5 h. (D) Reverse-phase HPLC (solvent C) of [3H]testosterone (D1) and [3H]estradiol (D2) taken from peaks T and E2, respectively, in C. (E) Profiles (solvent B) of [3H]testosterone metabolites after incubation of slices for 5 h. (F) Profiles (solvent B) of [3H]estradiol metabolites after a 5-h incubation. The arrows designate the elution peak position of the standard [14C]steroid with abbreviations: E1 (estrone), T (testosterone), and E2 (estradiol). “U” designates unknown metabolites. The vertical axis indicates 3H radioactivity (cpm). The retention time of the (same) standard [14C]steroid differed slightly among C, E, and F due to the different silica gel columns used. More than three independent experiments were performed for each of these analyses.

