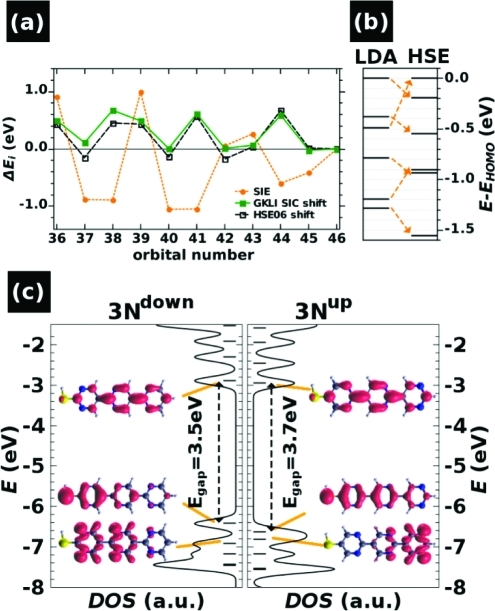
Figure 2.
Self-interaction error and electronic structure of the isolated 3Nup molecule. (a) The self-interaction error of the LDA orbitals is shown (orange) together with the GKLI SIC (green) and the HSE corrections (black). All quantities are given relative to the value for the HOMO (orbital 46). (b) LDA (left) and HSE (right) orbital energies, aligned to the respective HOMO energies. The arrows link associated orbitals. (c) Absolute HSE-computed eigenenergies of 3Ndown (left panel) and 3Nup molecule (right panel), broadened by a Gaussian with σ = 0.1 eV. The insets show orbital charge-densities of the frontier states; the HOMO–LUMO gap is indicated.

