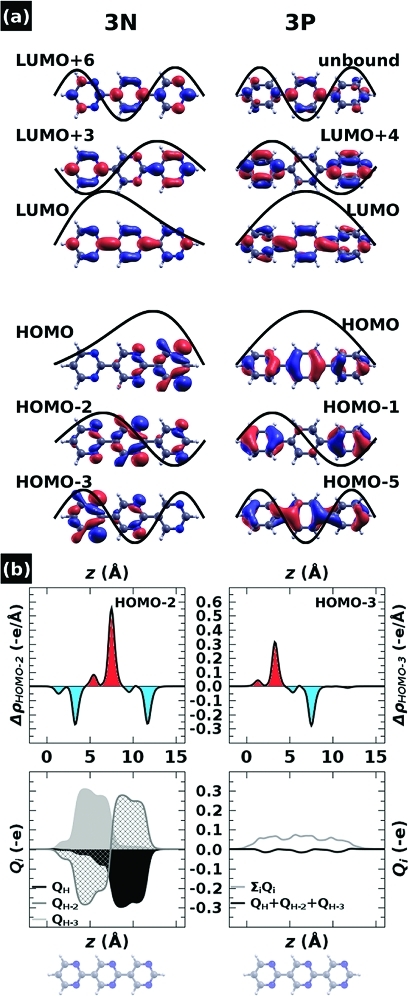
Figure 7.
(a) Isodensity plots for related occupied (lower plots) and unoccupied (upper plots) molecular orbitals of 3N (left) and 3P (right).(117) Also shown are schematic standing-wave envelope functions. (b) Upper panels: Charge rearrangements Δρi(z) = ρiSAM(z) –ρi(z) for the HOMO–2 (left) and HOMO–3 (right) upon monolayer formation. Red (blue) areas show accumulation (depletion) of electron density. For the equivalent plot for the HOMO, see Figure 5. Lower panels: Cumulative charge rearrangements upon SAM formation. Left panel: Qi(z) for the three related states HOMO (black), HOMO–2 (crossed gray), and HOMO–3 (light gray) of 3N. Right panel: Sum over the three Qi-curves shown in the left panel (black color) and sum over the Qi of all occupied states (gray color).

