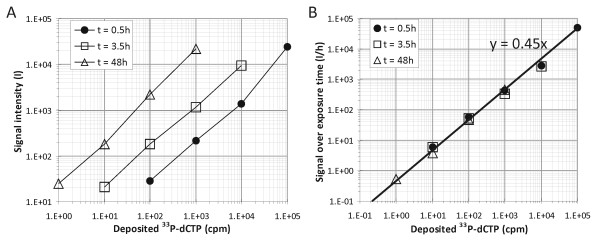
Figure 1.
Signal quantification of manually spotted volumes of 33P-dCTP. A) Signal intensity of scanned spots after exposure for 30 min (full circles), 3 h 30 min (open squares) and 48 h (open triangles), as quantified by our analysis software. B) Signal intensity of the same scans expressed per hour of exposure.

