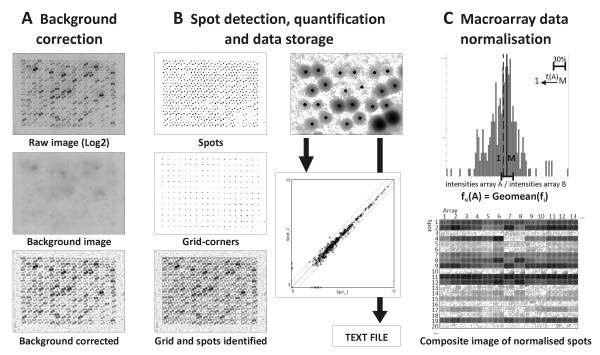
Figure 2.
Procedure flowchart for software image analysis. A) Background correction, B) spot detection, quantification and data storage, and C) batch macroarray normalisation, including a composite picture of the normalised spots over all arrays in the batch. In each distribution histogram of spot intensity ratios between two arrays, the 30% genes with maximal area under the curve that thus represent the bulk gene-population with the lowest differential expression, were selected and the median thereof calculated. The normalisation factor for a given array pair was then defined by the difference of this median to 1, and the geometrical mean of all the pair-wise normalisation factors as the global normalisation factor for a given array. M = median, fi(A) = normalisation factor for A to correct against a given other macroarray, fN(A) = global batch normalisation factor for macroarray A.

