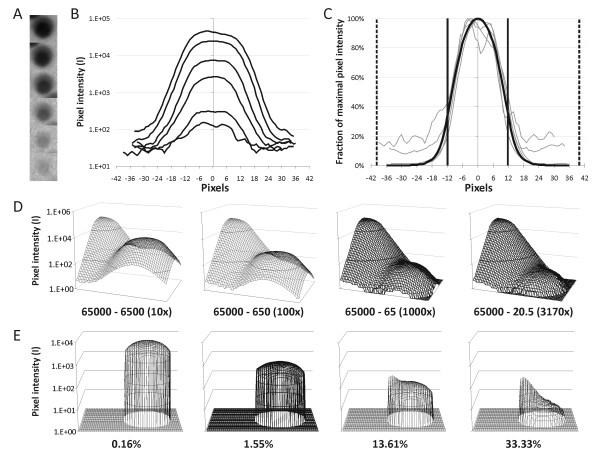
Figure 3.
Modelling of spot shape and intensity. A) Log-transformed pictures of a selection of six macroarray spots of different intensities. B) Determination of the spot intensity profile from spots depicted in A by measurement of the pixel intensity as a function of the pixel distance from the spot centre. C) Determination of the general spot shape (black curve) by expressing the intensity at each distance for every spot as a fraction of the maximum intensity (grey lines). Full vertical lines represent 85% of the area under the curve at a diameter of 24 pixels (1.2 mm); dashed vertical lines represent the spot distance on the macroarray membrane (at 40 pixels = 2 mm). D) Mathematical modelling of the potential signal overspill between two adjacent spots 2 mm apart. Maximal intensity of neighbouring spot and measured spot are indicated, with the ratio between brackets. E) Signal measured within the 1.2-mm diameter around the lower intensity spot centre for the respective situations illustrated in panel D. Percentages denote which fraction of the integrated signal intensity is caused by overspill from the neighbouring maximal intensity spot.

