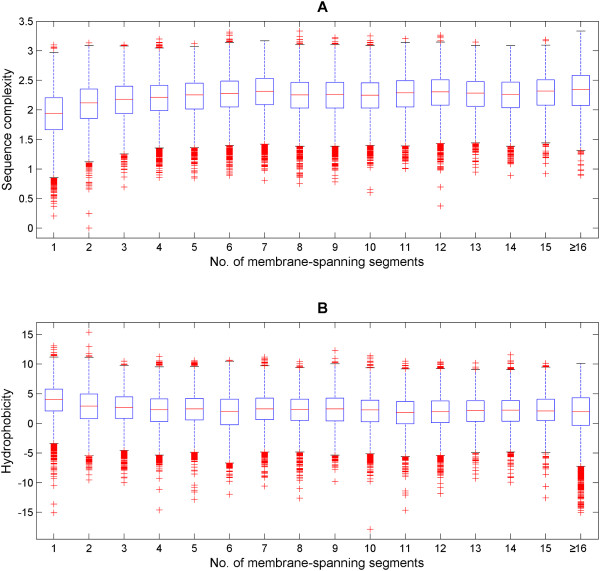
Figure 2.
Trends of complexity and hydrophobicity as a function of the number of TMs per protein in UniProt. The boxplots of complexity (Figure 2A) and hydrophobicity (Figure 2B) of the single-spanning to 15-transmembrane and beyond spanning sets are shown. The medians of the complexity and hydrophobicity measures increase with the number of spanning TM helices found in each set. Interestingly, the complexity boxplots highlighted an excess of outliers on the lower part of the complexity axis (suggestive of low-complexity sequence segments) while the hydrophobicity boxplots emphasized the excess of outliers on the bottom part of the hydrophobicity axis (towards charged composition). This is independent of the size of the membrane-spanning proteins. Taken together, this is somewhat contrary to the expectation that TM helices are simple and purely hydrophobic. Therefore, it raises the notion that some TM helices are 'simple' and others are 'complex' regardless of the number of TMs in a protein.

