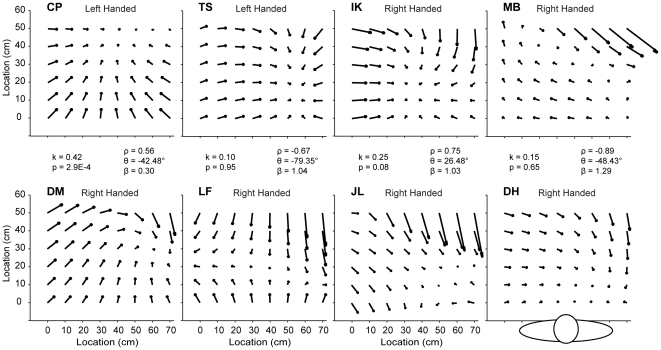
Figure 2. Idiosyncrasy of Pattern of Errors Across Subjects.
Distribution of errors from six right-handed and two left-handed subjects when using the Right hand in the Touch condition. Each arrow represents the constant error predicted by the fourth-order regression. The human figure represents the location of a subject with respect to the grid and the resulting pattern of errors. The text in the middle of the figure represents the resulting values from the K-S test and vector correlation analysis for the comparison between the adjacent (above and below) two vector fields.

