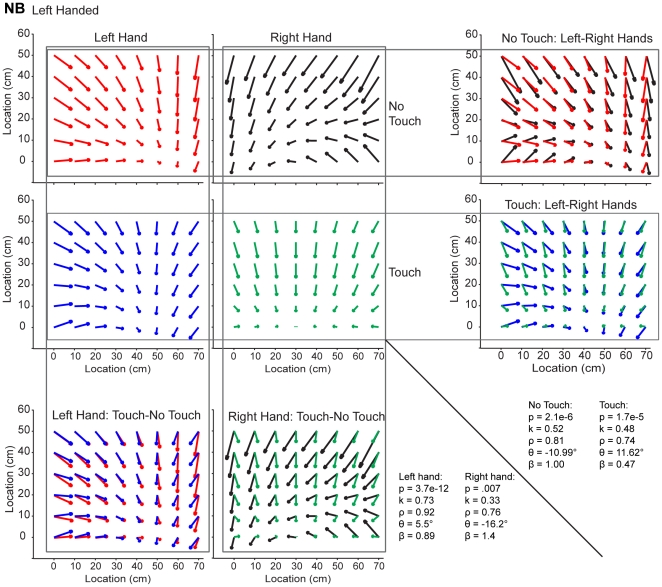
Figure 3. Similarity of Pattern of Errors Across Hands and Conditions.
Distribution of errors from one left-handed subject for both hands and both tactile feedback conditions. The text in the right bottom corner represents the resulting values from the K-S test and vector correlation analysis for each of the comparisons in the figure.

