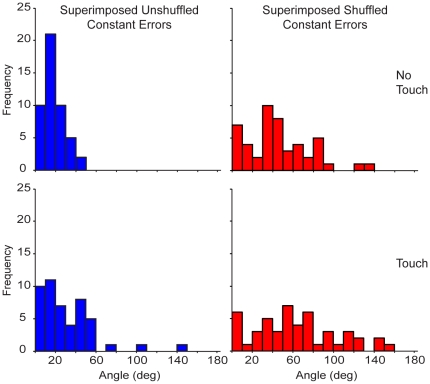
Figure 4. Histograms of the angles between the superimposed vectors.
The left histograms show the angle distribution of the superimposed constant error vectors across hands for the subject displayed in Figure 3. The right histograms show the angle distribution of the superimposed vectors when the constant errors from one hand were shuffled before being superimposed.

