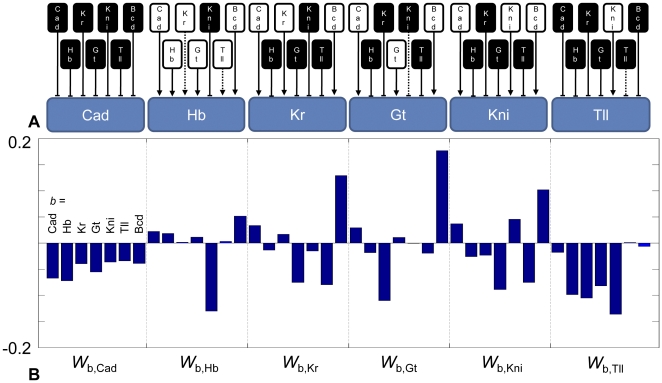
Figure 1. Gap gene genetic regulatory network.
The model representation of the gap gene network. The network topology in (A) represents negative (black box, flat line) and positive (white box, arrowhead line) regulatory effects on each target gene (blue). Dashed lines represent near-zero regulatory inputs that may be negligible. This qualitative topology is quantified in (B) as a set of genetic regulatory network (GRN) weight parameters wb,a, the influence of gene b on gene a. From left to right, each set of seven inputs represent Cad, Gt, Hb, Kni, Kr, Tll, and Bcd. Each cluster of seven interactions represents a target gene Cad, Gt, Hb, Kni, Kr, and Tll.

