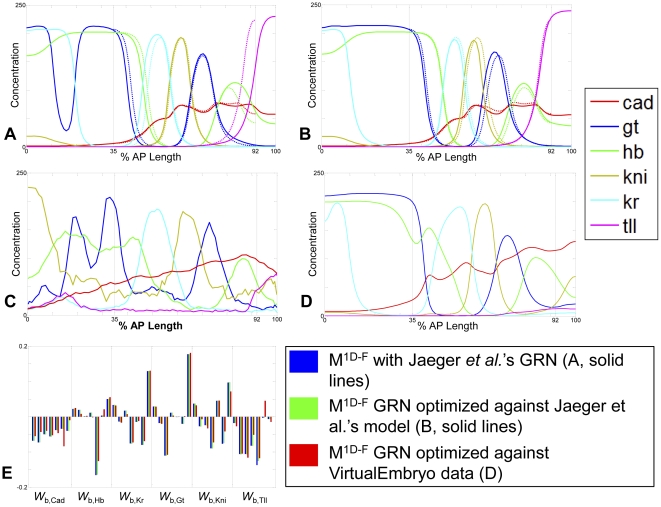
Figure 2. One-dimensional model results.
Model output was simulated over a 0–100% AP length domain using the optimal GRN reported by Jaeger et al. Solid vertical lines represent the original model boundaries, not used in this simulation. (A)  (solid lines) shows qualitative agreement with the Jaeger model
  (dashed lines) in the 35–92% AP range, but shows discrepancies at either end of the domain due to the movement of boundaries; all species displayed at t = 70 min. (B) The best-fit GRN from Jaeger et al. was locally optimized to improve the agreement of the 0–100% AP length, model
  (solid lines), and the original Jaeger et al. original model (
 dashed lines); all species displayed at t = 70 min. (C) VE protein data for Gt, Hb, Kni, Kr at t = 70 min; VE mRNA data for Tll at t = 70 min; protein data from Jaeger et al. for Cad at t = 56 min. (D) Model output (
 ) was also optimized against VE data (RMSE = 13.992); Gt, Hb, Kni, Kr, Tll at t = 70 min; Cad at t = 56 min. Despite modest improvements in model agreement in the 35% and 92% region (C–D), the resulting changes in parameter values were small. (E) Optimized parameter magnitudes vary but signs remained the same in most cases (blue -
  ; green -
  ; red -
  ).
).

