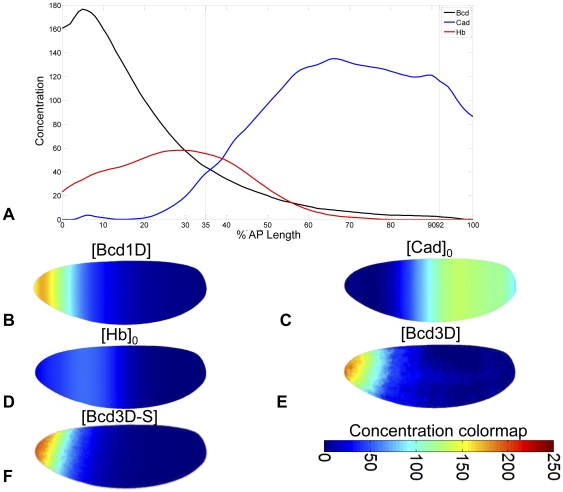
Figure 3. 1D and 3D initial conditions.
Initial conditions in various models. (A) 1D model initial conditions, reported by Jaeger et al., and used in models  and
and  . (B) 1D initial conditions were mapped onto the 3D embryonic geometry (
 ). (C), 1D initial Cad protein distribution, (D) 1D initial Hb protein distribution. Subsequent models incorporated (E) DV-asymmetric interpolated [Bcd] distribution (
 ) or (F) smoothed DV-asymmetric interpolated [Bcd] distribution (
 ).
).

