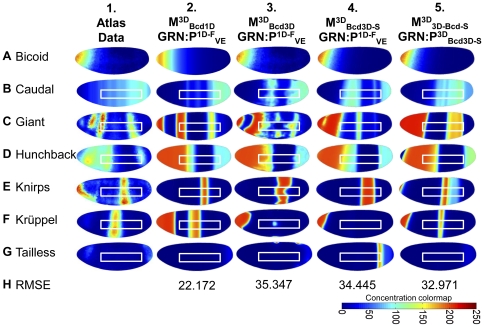
Figure 4. Three-dimensional model results.
Simulation results in the 3D model. (A–H) Lateral view of VE geometry is shown in rows A–G (Gt, Hb, Kni, Kr, Tll at t = 70 min, Cad at t = 56 min); row H displays RMSE difference between model and VE data summed with all time points. Column 1 shows scaled VE data. Column 2 displays output from  evaluated with GRN
  . Column 3 contains output from
  incorporating DV-asymmetric Bcd data and GRN
  ; Column 4 illustrates the effect of the smoothed Bcd interpolant in
  while considering the same GRN
  . Column 5 displays output from
  with reoptimized parameters
  . White boxes indicate the lateral areas where Jaeger et al. optimized their 1D model. Animations of pattern development are available for column 2 (
 , Movies S1, S2, S3, S4, S5, S6) and column 5 (
 , Movies S7, S8, S9, S10, S11, S12) in the supplementary material.

