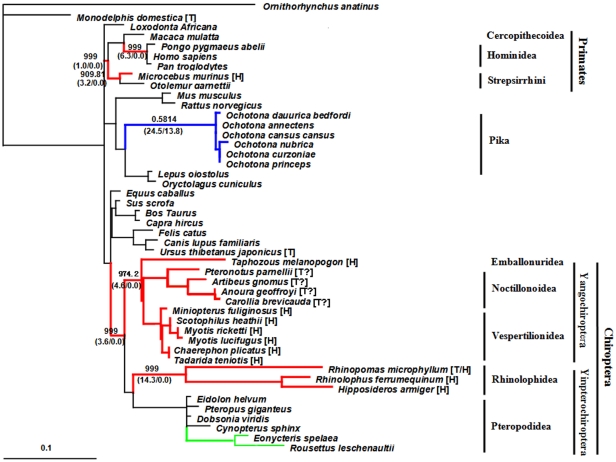
Figure 3. The phylogenetic gene tree of Leptin.
The gene tree was based on nucleotide sequences of Leptin exon 3 and used for the codon maximum likelihood analysis. The ω ratios and numbers of non-synonymous substitution (N*dN) and synonymous substitution (S*dS) of some specific lineages were shown in bold and in bracket. The scale bar of “0.1” means 0.1 nucleotide substitution per site. [T], torpor; [H], hibernator. Lineages with ω>1 were shown in red (heterothermy) and green (homeothermy). The Pika lineage as control was shown in blue. ?: it is likely heterothermic.

