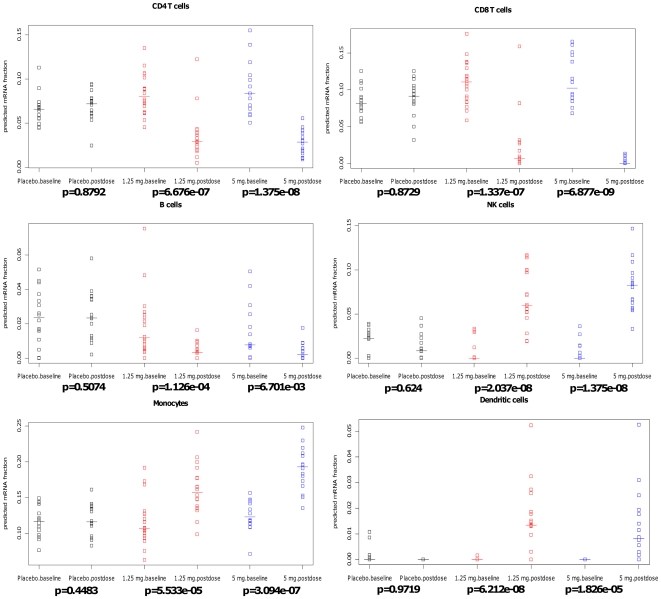
Figure 3. Estimated fractions for several circulating cell populations.
Strip charts display relating quality of CD4+ cells/CD8+/B cells/NK cells/Monocytes/Dendritic cells. The data are stratified in three different subgroups: placebo (black), low dose: 1.25 mg/day (red) and high dose: 5 mg/day (blue). Data points are from each donor. Y axis is the estimated mRNA fraction. P-values are calculated by Wilcoxon's Signed Rank test.

