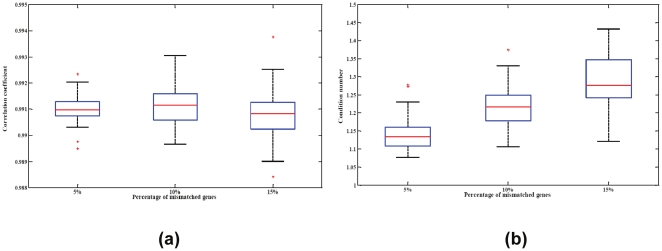
Figure 5. Stability of the signature matrix.
(a) Boxplot displaying the stability of chosen signature matrix. The chosen signatures are distorted by randomly selecting 5, 10, or 15 percent of its genes and randomly modulating their values with 2 fold changes. The distribution of correlations between actual mixing fractions and fractions estimated using these signatures is depicted. (b) Condition number of the basis matrix with respect to the percentage of simulated differentially expressed genes in the basis matrix.

