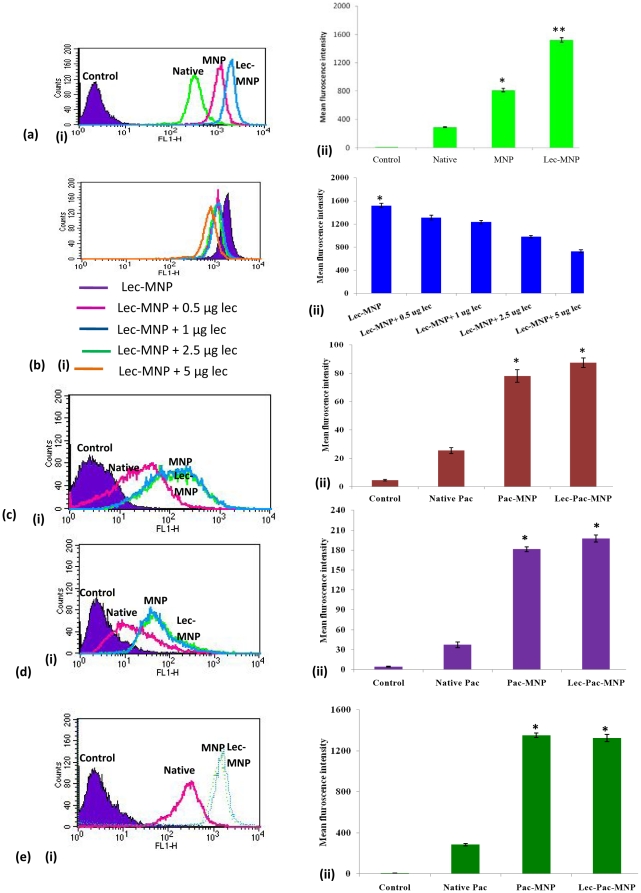
Figure 3. Uptake studies.
(A) Uptake analysis of native 6-coumarin, 6-coumarin-MNPs and lec-6-coumarin-MNPs in K562 cells (i) through flow cytometry (ii) Mean fluorescence intensity obtained from flow cytometry. (B) Competitive inhibition assay study for uptake of lec-6-coumarin-MNPs by adding different concentrations of native lectin in K562 cells (i) through flow cytometry (ii) Mean fluorescence intensity obtained from flow cytometry. (C) Uptake analysis of native 6-coumarin, 6-coumarin-MNPs and lec-6-coumarin-MNPs in Kcl22 cells (i) through flow cytometry (ii) Mean fluorescence intensity obtained from flow cytometry. (D) Uptake analysis of native 6-coumarin, 6-coumarin-MNPs and lec-6-coumarin-MNPs in Jurkat cells (i) through flow cytometry (ii) Mean fluorescence intensity obtained from flow cytometry. (E) Uptake analysis of native 6-coumarin, 6-coumarin-MNPs and lec-6-coumarin-MNPs in HEK293 cells (i) through flow cytometry (ii) Mean fluorescence intensity obtained from flow cytometry. Data as mean ± S.E.M., n = 6. (*) p<0.05, (**) p <0.01.

