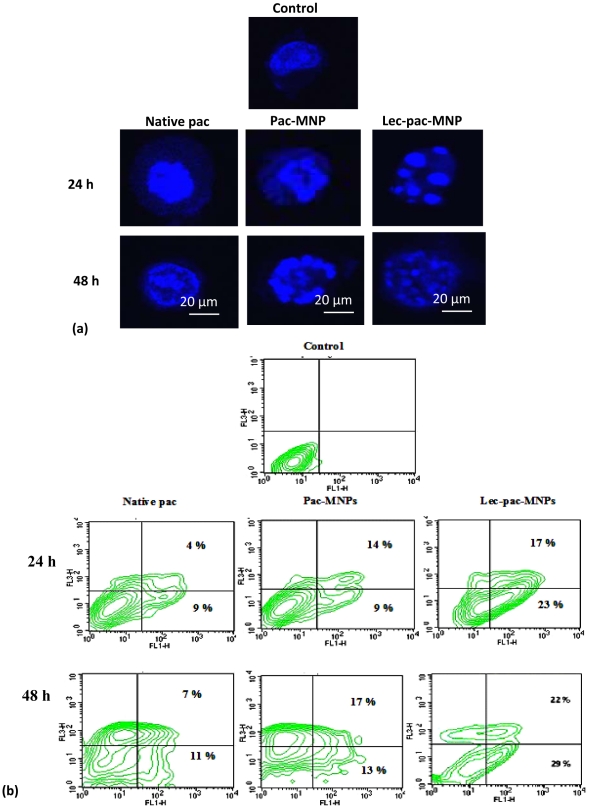
Figure 7. Apoptosis study in K562 cells.
(A) Morphological analysis of K562 cells after treatment with native pac, pac-MNPs and lec-pac-MNPs (Conc. 10 ng/ml) after 24 and 48 h by confocal microscopy. (B) Induction of apoptosis in K562 cell line by native pac, pac-MNPs and lec-pac-MNPs (Conc. 10 ng/ml) after 24 and 48 h using Annexin V- FITC. Flow cytometry analysis reveals the presence of different populations of cells. Top right: late apoptotic and necrotic cells; bottom left: live cells and bottom right: early apoptotic cells.

