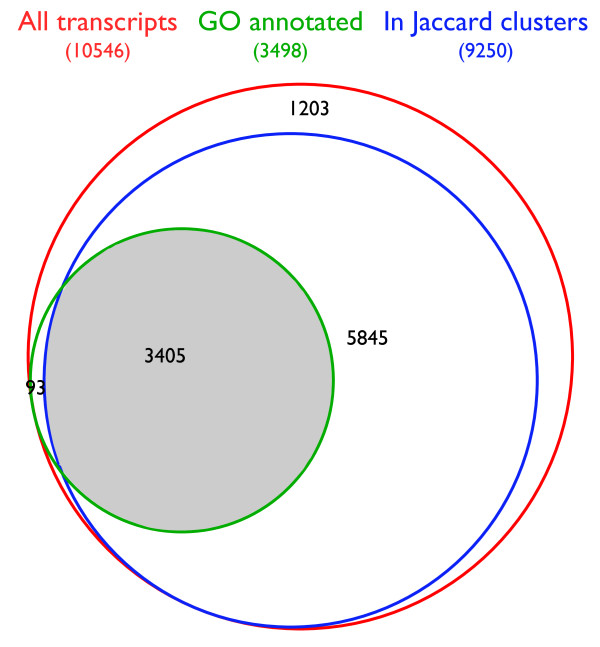
Figure 1.
Mapping A. nidulans GO annotation to Jaccard orthologous clusters. Area-proportional Venn diagram [39] showing fractions of all A. nidulans transcripts (red) annotated by GO (green) and/or associated with Jaccard orthologous protein clusters (blue). The intersection of all circles (gray), comprising 3405 transcripts, was used to map A. nidulans GO annotation to seven other Aspergillus species.

