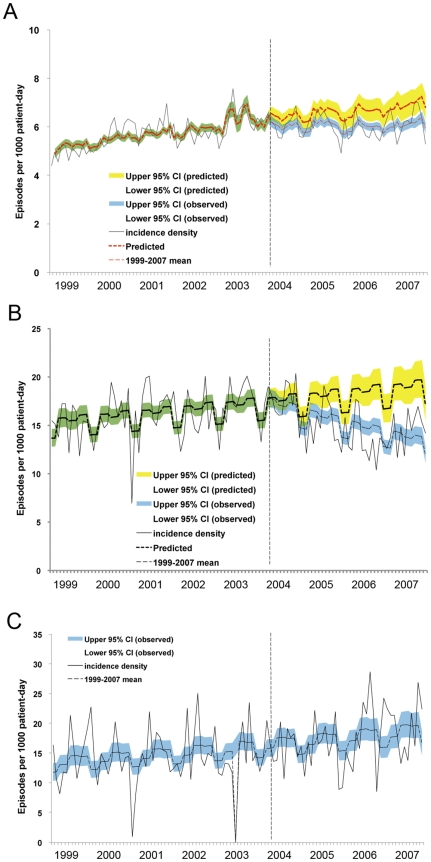
Figure 2. Time trends of monthly cumulative incidences of overall healthcare-associated infection before (January 1999 to March 2004) and during the hand hygiene program (April 2004 through December 2007).
(A) hospital-wide (change in levels, p = 0.02; change in trends, p = 0.04); (B) intensive care units (change in levels, p = 0.26; change in trends, p<0.001); (C) hematology ward (p = 0.21, p = 0.38, respectively). Observed incidences, black solid line, —; mean, red dash line, ---; green and blue shadow, 95% confidence interval of observed incidences; yellow shadow, 95% confidence interval (CI) of predicted incidences. The vertical dashed lines (- - -) separate the preintervention and intervention periods.

