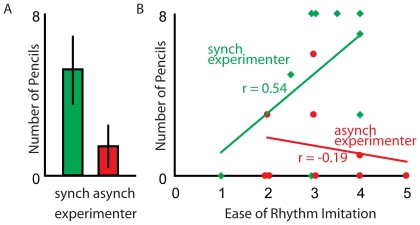
Figure 1. Prosocial commitment test results (A) and the ease of rhythm imitation (B).
(A) Mean (and standard deviation) of the number of pencils picked up in order to help I.K. in the prosocial commitment test after experiencing her as a synchronous (green) or asynchronous drummer (red) in the manipulation run. (B) Correlation between the number of pencils and the ease of rhythm imitation as a function of synchrony (green: I.K. who played in-synch; red: she played out-of-synch during the manipulation run). The lines represent the linear best fit and r refers to the correlation coefficient.

