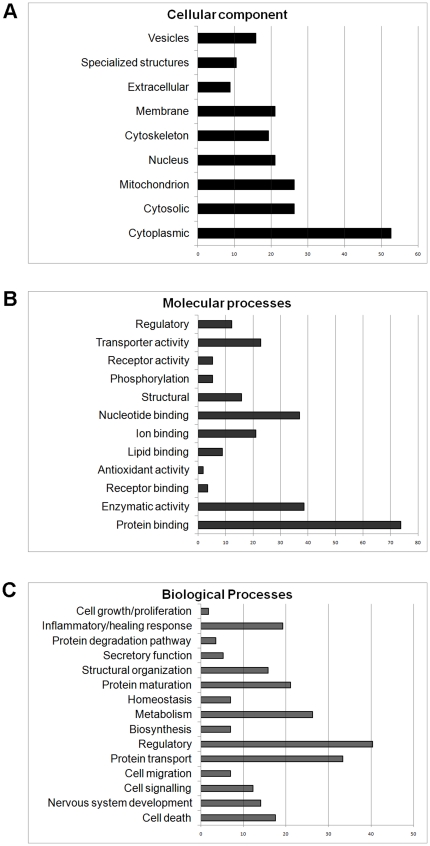
Figure 2. Ontological analyses of proteins identified by mass spectrometry that changed in response to spinal cord injury.
Bar charts summarize the distribution of proteins that changed in response to spinal cord injury at all ages according to ontological categories (y-axis) and number of proteins (x-axis) in each category in terms of (A) cellular localization, (B) molecular function and (C) biological processes.

